 The most detailed account of the C-14 carbon dating results for the Gospel of Judas manuscript in Codex Tchacos, of which I am aware, is found in the book by journalist Herbert Krosney, The Lost Gospel: The Quest for the Gospel of Judas Iscariot, published by National Geographic (April 6, 2006).
While I am aware of other discussions (particularly in The Gospel of Judas, 1st edition [April 6, 2006], p. 184, and 2nd edition [2008], p. 209, also published by National Geographic, and by Peter M. Head in the Tyndale Bulletin [2007]), they demonstrate dependence on Krosney (or, in the case of the brief account on Krosney’s page 326, perhaps a statement not from Krosney but rather prepared at National Geographic and used in both books published by National Geographic). The exact same quote (with some of the same surrounding context) is shared between Krosney’s book on page 326, the 1st edition of the Gospel of Judas book on page 184, and the National Geographic webpage.
There is an (apparently independent) account by Lori Stiles on March 30, 2006 for the UA News, which confirms the substance of the quote (but does not explicitly give it) found on the webpage and in the books published by National Geographic.
There is a 2014 paper on “Carbon Dating and the Gospel of Judas” by Christian Askeland delivered before the SBL at San Diego, which I have not read (but would certainly like to). There may be other information available elsewhere, which I would be very interested in. Of course, the full details must exist somewhere, right? If nobody else, Jull and Hodgins should be able to confirm the details of the tests run.
Here is what I’ve been able to determine (or guess) from Krosney, however, who gives the most detailed account that is available to me right now.
[Added March 10, 2015. Christian Askeland has given us a blog post update at Evangelical Textual Criticism, including this exciting quote from that blog post: “The National Geographic Society granted the Arizona AMS laboratory permission to send me the actual results, and I am publishing an update on the dating of the Tchacos Codex based on the findings.” Also, “The lab had six test results.”]
Krosney’s Account
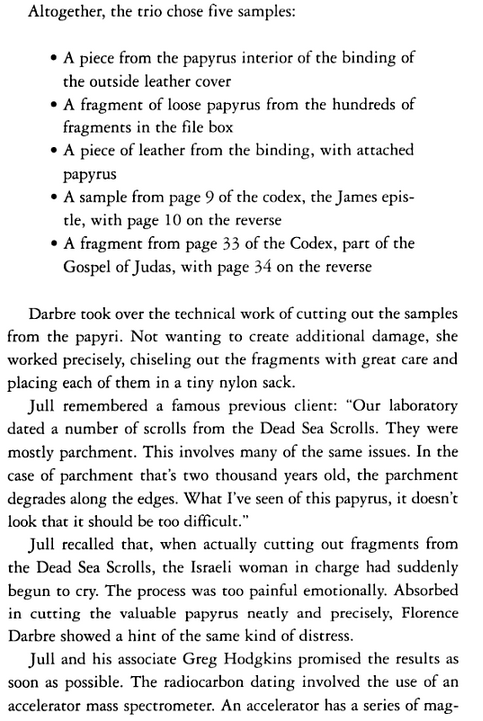
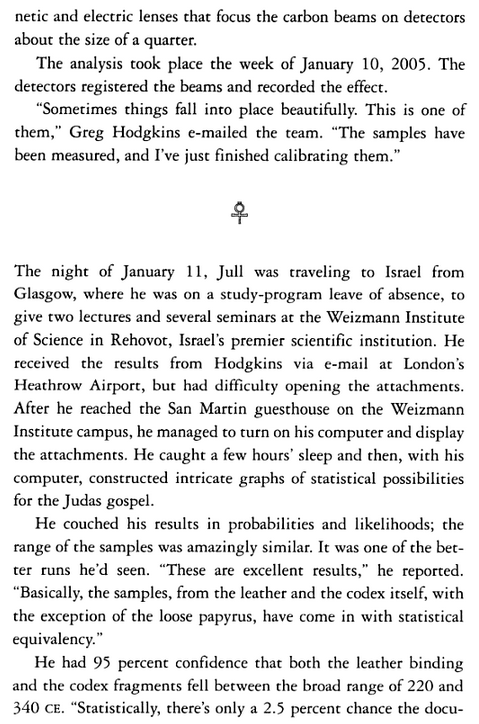
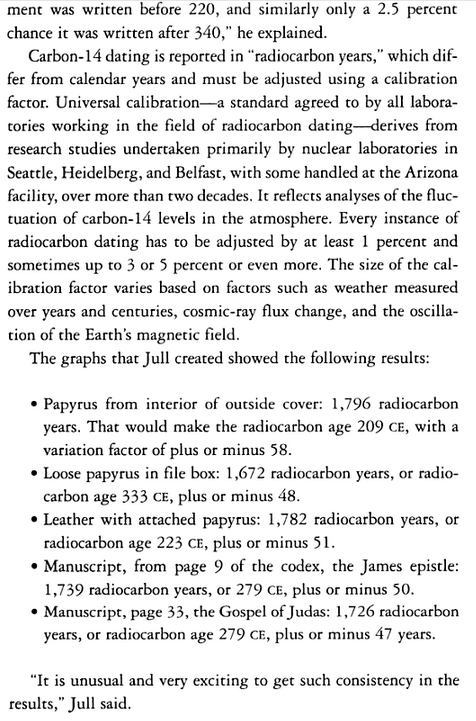
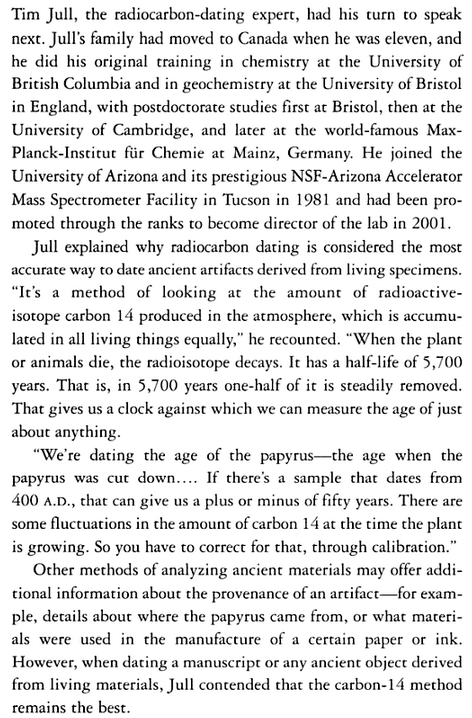
The raw data (such as it is) is reflected in the account presented by Krosney on pp. 271 to 273, but it may need to be read with caution due to the second-hand nature of the report and the non-expert status of the reporter. Here is Krosney’s account on these pages.
First of all, what is the scientific definition of “radiocarbon years”? Krosney mentions this term once at the top of the page, where he explains it for the reader, and again at the bottom of the page, where it is associated with the results that he reports. It is not his own term.
Radiocarbon Years
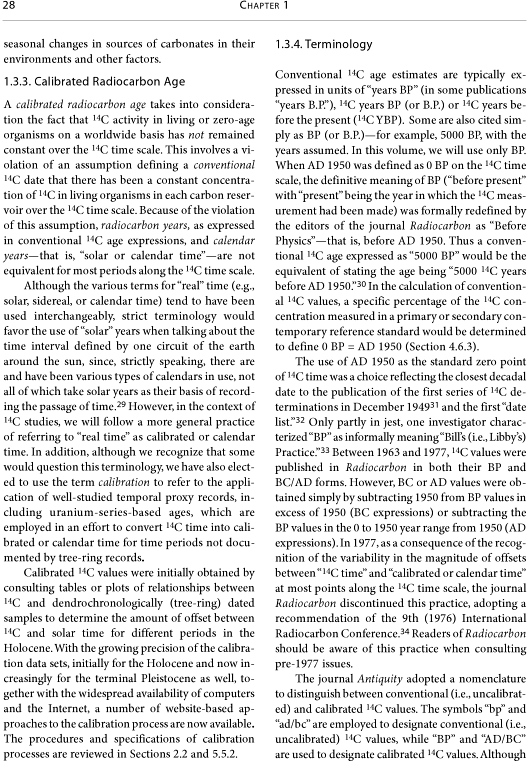
As seen from this textbook (Radiocarbon Dating), “radiocarbon years” and “conventional C-14 age expressions” are closely related concepts. They are not calendar years.
In the Encyclopedia of Scientific Dating Methods, we read about such conventional expressions:
Stuiver and Polach (1977) define a radiocarbon date to include five things: (a) the use of the 5,568-year half-life (mean life 8,033 years); (b) the assumption of constancy of 14C atmospheric level during the past; (c) direct or indirect comparison to a known standard, oxalic acid; (d) isotopic fractionation normalization of all sample activities to the base of δ13C = −25 ‰; and (e) the year 1950 which is automatically the base year, with ages given in years BP (i.e., where present is defined as AD 1950).
This is a very specific set of criteria for publishing conventional radiocarbon ages.
To run roughshod over the science (forgive me if I have misrepresented it somehow) of radiocarbon dating very quickly, there are two isotopes of Carbon in the sample that are measured: C-14 and C-12. The C-14 is an unstable isotope, while the C-12 is a stable isotope. While something is alive, it is absorbing and replenishing its carbon from the atmosphere. At the moment it dies, its carbon composition is representative of the atmosphere it breathed while alive. After something is dead, its C-14 as a fraction of C-12 will decrease, because of the radioactive decay of the unstable C-14 isotope. This lets us look at how much carbon it had, versus how much C-14 carbon it lost, due to the (roughly speaking, steady) radioactive decay of this carbon isotope.
When the lab performs the radiocarbon measurements, it is getting just that one measurement, which is the ratio of the C-14 content to the C-12 content. This C-14 content level is measured and reported with one standard deviation. It is then converted into a “radiocarbon date” (equivalently, “radiocarbon age” and “radiocarbon years” BP) according to the conventions described above.
The Wikipedia page on Radiocarbon dating actually seems to be fairly good and goes over some of the potential pitfalls involved in radiocarbon dating. The “calibration” step specifically corrects for errors arising from the fact that the ratio of C-14 to C-12 in the atmosphere is not always and everywhere constant. Depending on when and where an organic artifact began decaying, it might have a little “extra” or a little “missing” C-14, relative to C-12, than other artifacts from other times and places. (In particular, it might be different than the values codified and embedded in the conventional “assumption of constancy of C-14 atmospheric level during the past.”) This, therefore, obliges us to make adjustments from the conventional radiocarbon date, called “calibration,” if we want to know how old something is.
Radiocarbon Years = RCYBP?
Despite the indications in Krosney’s text that might be taken to the contrary, it is hard to understand anything other than conventional “radiocarbon years” BP being reported by his figures. That is, the first set of figures. The second set of figures seem to be the journalist’s own, however.
- The conventional method of reporting “radiocarbon years” is strictly in reference to the year 1950 (“BP”). The results from the lab would have come back this way. The calculation of the range of radiocarbon years BP, within one standard deviation, from the ratio of C-14 content, is a strictly-defined and somewhat-complicated mathematical computation. It would not be repeated or reworked.
- No scientist would add 55 to it in order to get “radiocarbon years before 2005.” This would both be confusing and be a detour away from the next step, which is calibration performed against the conventional C-14 age expression. (Calibration software and tables are of no help without the conventionally-expressed radiocarbon age.) However, a journalist might subtract these figures from the current year, 2005, in an attempt to understand the figures.
- While some scientists might express a radiocarbon age (which is uncalibrated, by definition) directly in terms of the years “AD” or “CE,” it is not a widely accepted practice, due to the confusion that can result. Typically, especially in the 21st century, that’s reserved for calibrated dates.
- In general, the journalist is more likely to make a simple mathematical error than the scientist is, when the scientist has years of experience interpreting this kind of data. The math for the second set of figures is simply wrong in one location. For the fourth fragment, in order to follow the pattern established, it should have subtracted 1739 from 2005, to arrive at 266. Instead it is in error and mimics the fifth fragment’s second figure. It is just barely possible that the journalist has just made a copying error, while attempting to copy these figures carefully, but that does not remove the grave pall of suspicion from the second set of figures.
Moreover, we can be fairly confident that the first set of numbers is uncalibrated, not calibrated. The reason for my confidence here is not simply due to the reference to “radiocarbon years,” which already indicates as much. The very specific band of +/- margins of error mentioned, all between 47 and 58 years on each side, correspond exactly to what we would expect of an uncalibrated result of a C-14 test and, specifically, to the 1-sigma confidence level that is used to express radiocarbon age results. For such figures, we should expect a figure between 40 and 60 years on each side, as Jull’s own publication record bears out:
“The AMS method has generally improved since its inception, so that external precision of about ±0.5 percent in 14C content, or ±40 years in uncalibrated radiocarbon age are possible on 1-mg-sized samples.”
“For radiocarbon ages, errors of about ±50 years on recent material are typical for accelerator measurements.”
– A. J. T. Jull, “Accelerator radiocarbon dating of art, textiles, and artifacts,” in Nuclear News (June 1998).
The use of +/- expressions (“plus or minus”) is also consistent with the idea that we are seeing (uncalibrated) “radiocarbon years” here. A radiocarbon age follows a normal distribution and generally is given as a figure “plus or minus,” while a calibrated range of dating is only able to be given such expression by a secondary calculation, as it does not follow a normal distribution.
Most importantly, calibrated dates are never called “radiocarbon years,” and, while they may sometimes be counting backwards in calendar years (e.g., “cal BP,” years before 1950), they never do so with respect to the year 2005, which is the interpretation that the journalist put on these figures.
Therefore, I conclude that we must discard the figures with “CE” dates next to them on page 273 of Krosney’s book. Unfortunately, while we are on fairly solid ground in having doubt about these figures, we are not on completely solid ground when interpreting the figures that remain. We require further clarification in order to interpret this evidence more precisely and conclusively.
While I do indeed await further clarification on these matters, I will, for the sake of curiosity, proceed on the less than conclusive (but quite reasonable) assumption that all of what I have suggested above is correct, just to see what follows.
Proceeding by Said Reasonable Guess…
By the simple procedure of removing the second set of numbers (which do not make much sense for a scientist) and adding the expected “BP” (which was easily misunderstood by the journalist), we are faced, accordingly, with five test results:
- 1796 +/- 58 Radiocarbon Years BP (“papyrus from interior of outside cover”).
- 1672 +/- 48 Radiocarbon Years BP (“loose papyrus in file box”).
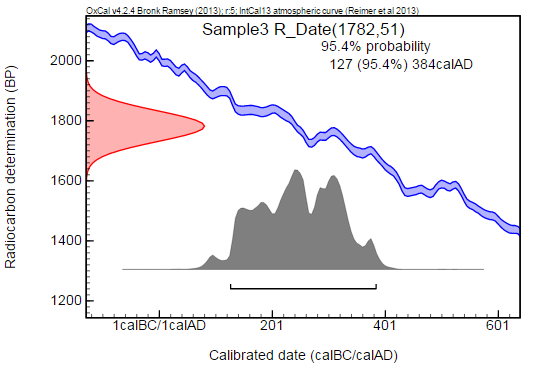
- 1782 +/- 51 Radiocarbon Years BP (“leather with attached papyrus”).
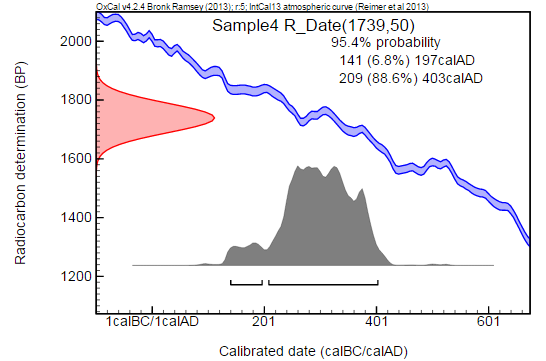
- 1739 +/- 50 Radiocarbon Years BP (“manuscript, from page 9 of the codex, the James epistle”).
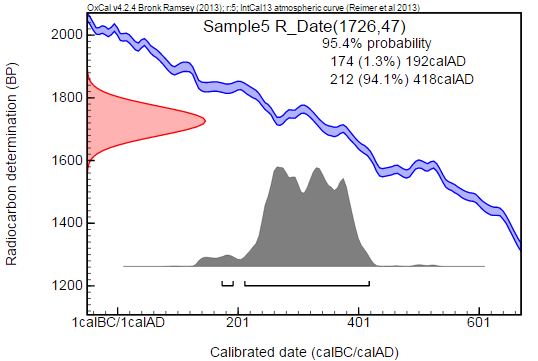
- 1726 +/- 47 Radiocarbon Years BP (“manuscript, page 33, the Gospel of Judas”).
These are uncalibrated results (again, of course, if we accept that we can reconstruct this much from reading Krosney’s book).
…And Thus Arriving at Some Reasonable Conjectures
With this much information, one can do the step of calibration from their computer at home.
There may be some differences, depending on which software is used (rather, depending on which underlying dataset is used by the software and the form in which the results are presented). I will try a few.
CalPal Online
Software here, using the CalPal2007_HULU curve. (Not necessarily the most reliable or most detailed results, but still an interesting point of comparison with the other software below.)
- 14C-age BP: 1796 ± 58
Calendric Age calBP: 1723 ± 81
68% range calBP: 1642 – 1804
Calendric Age calAD: 227 ± 81 - 14C-age BP: 1672 ± 48
Calendric Age calBP: 1599 ± 64
68% range calBP: 1534 – 1663
Calendric Age calAD: 351 ± 64 - 14C-age BP: 1782 ± 51
Calendric Age calBP: 1711 ± 76
68% range calBP: 1634 – 1787
Calendric Age calAD: 239 ± 76 - 14C-age BP: 1739 ± 50
Calendric Age calBP: 1651 ± 61
68% range calBP: 1590 – 1712
Calendric Age calAD: 299 ± 61 - 14C-age BP: 1726 ± 47
Calendric Age calBP: 1640 ± 57
68% range calBP: 1582 – 1697
Calendric Age calAD: 310 ± 57
Calib 7.1
Software here, using the IntCal13 curve.
- (1 sigma – 68.3% area enclosed)
cal AD 135-258 [80.8% relative area]
cal AD 284-290 [2.8% relative area]
cal AD 295-321 [16.4% relative area]
(2 sigma – 95.4% area enclosed)
cal AD 86-110 [3.6% relative area]
cal AD 115-357 [94.3% relative area]
cal AD 365-380 [2.1% relative area]
Median probability: cal AD 227 - (1 sigma – 68.3% area enclosed)
cal AD 263-276 [8.3% relative area]
cal AD 329-421 [91.7% relative area]
(2 sigma – 95.4% area enclosed)
cal AD 244-434 [91% relative area]
cal AD 455-469 [1.5% relative area]
cal AD 487-533 [7.6% relative area]
Median probability: cal AD 369 - (1 sigma – 68.3% area enclosed)
cal AD 143-154 [5.8% relative area]
cal AD 168-195 [14.5% relative area]
cal AD 209-264 [39.5% relative area]
cal AD 273-330 [40.2% relative area]
(2 sigma – 95.4% area enclosed)
cal AD 128-382 [100% relative area]
Median probability: cal AD 246 - (1 sigma – 68.3% area enclosed)
cal AD 242-350 [92.5% relative area]
cal AD 367-379 [7.5% relative area]
(2 sigma – 95.4% area enclosed)
cal AD 141-160 [2.3% relative area]
cal AD 165-196 [4.1% relative area]
cal AD 208-404 [93.6% relative area]
Median probability: cal AD 297 - (1 sigma – 68.3% area enclosed)
cal AD 253-303 [45.6% relative area]
cal AD 314-358 [39.6% relative area]
cal AD 363-381 [14.8% relative area]
(2 sigma – 95.4% area enclosed)
cal AD 175-191 [1.1% relative area]
cal AD 212-418 [98.9% relative area]
Median probability: cal AD 311
OxCal
Software here, using the IntCal13 curve.
Maybe the Best Argument That Something Like This Was Meant?
The best argument that something like this was meant (if not, in fact, exactly this in every detail) by the figures given in Krosney’s book would be its consistency with two other very reasonable assumptions. Namely, (1) that the team in charge of the radiocarbon dating performed the standard procedure of calibration before attempting to interpret the results calendrically, and, (2), that the results, once calibrated, showed remarkable consistency in showing dates from the third and fourth centuries as the most probable range. These are not just assumptions; these things are explicitly stated in quotations from the leader of the scientific team, Jull.
Jull clearly explained the idea of calibration, even when speaking to a lay audience, while explaining radiocarbon dating, as given in Krosney’s account (p. 269):
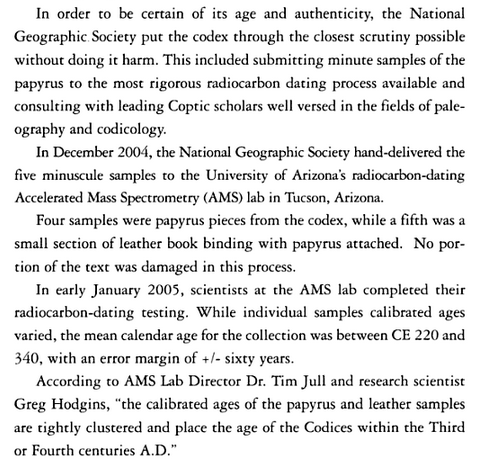
Moreover, the quote given in Krosney’s book on p. 326 (and in the 1st edition of the Gospel of Judas, published by National Geographic at the same time, on p. 184) clearly mentions the use of calibrated ages (collectively, the calibrated datings seem “tightly clustered,” specifically “within the Third or Fourth centuries A.D.”):
While the “between CE 220 and 340” claim was widely repeated, this was not the result of any single test of any single sample. Rather, this claim was an inference, an inference reached by the statistical analysis of Jull, as described in the long account originally quoted.
In this account, two steps very clearly occur.
(1) Greg Hodgins e-mails the team, during the week of January 10, 2005. He writes, “The samples have been measured, and I’ve just finished calibrating them.” At the very earliest stage, and only naturally (for anyone who has read some reports regarding radiocarbon dating – and as illustrated from this summary of one or several in a paper from Jull himself), the report has been produced with both the “radiocarbon years” data and the calibrated results with the statistically-probable ranges of dating (not unlike the graphs and figures provided above).
(2) While in Europe, Tim Jull pores over this data and tries to construct a mathematical model that might allow him to narrow down the range of dating further, given the fact that he is dealing with not just one sample’s result but rather with five.
While the details of the former have not yet been published in the most unambiguous way possible, and though the details of the latter are almost completely opaque, enough of the picture is clear. The team had certainly used calibrated results towards forming their final conclusions.
Specifically, their relatively-narrow band of dating for a relatively-high level of confidence, in the most famous formulation of the dating results, arose from mathematically combining the data and treating them as separate measurements of the same object (or, perhaps, different objects very close together in time). The independent report in UA News confirms this idea and the fact that they used calibrated ages (although it does happen to raise the possibility, which may or may not be the reporter’s error, of a sixth measurement, obtained by measuring the leather and papyrus of the third sample separately):
The UA scientists completed the radiocarbon dating tests in early January 2005. They had five samples. However, one book binding piece also contained papyrus, so they determined radiocarbon ages for both leather and papyrus in that fragment. The calibrated ages for all individual samples agreed to an astonishing degree within the third or fourth centuries A.D., Jull and Hodgins said.
“Given the clustering of the dates the five samples and the nature of the object (a book), one can argue that, in fact, a single object was measured six times,” they said.
These conclusions are uncannily consistent with the interpretation of the first set of figures in the book from Krosney as, indeed, “radiocarbon years” (BP). Notice how the biggest “hump” in every single graph above rests fairly square on top of the third and fourth centuries, the very observation quoted from Jull and Hodgins.
An Alternative?
An alternative interpretation has been suggested, which has none of the advantages (in terms of explaining the particulars of the material found in Krosney’s book) of the one proposed above. It also has several disadvantages.
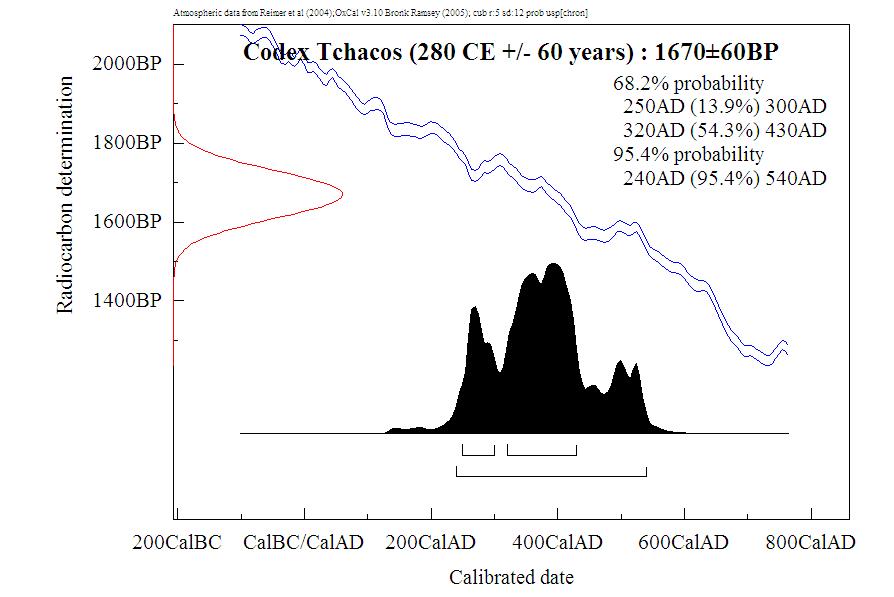
- It proceeds from the completely unwarranted and unreasonable assumption that the “280 CE” figure used by National Geographic refers to an uncalibrated conventional radiocarbon age.
- It tends to assume (whether explicitly or not) something very close either to a conspiracy or incompetence on the part of the team.
- It arrives at a graph that contradicts the statements of the team about the results, due to the fact this “alternative” involves a relatively high probability of a fifth century dating.
- It also assumes that the famous “+/- 60 years” is for an uncalibrated conventional radiocarbon age range (which is within one standard deviation, i.e., a 1-sigma interval), even though Krosney lists five actual “plus or minus” figures for the individual fragments, without any of them having the number 60,
- and without any of them being centered on a radiocarbon age of 1670 [“280 CE”] (although the uncalibrated radiocarbon age of a single fragment, just the second one, does miss this by two years with its 1672 RCYBP),
- and even though the account from Krosney specifically explains the 280 CE +/- 60 years range (originally stated as a range “between” 220 and 340 CE and not necessarily implying a normal distribution) as being the result of additional computation, from the calibrated ages,
- and being stated at a “95 percent confidence,” implying a 2-sigma interval, which is not used when representing a conventional radiocarbon age (instead, a 1-sigma interval corresponding to the range within a single standard deviation is used).
This “alternative interpretation” is represented by P. R. F. Brown’s webpage, which I have already criticized recently for its erroneous information regarding the Nag Hammadi Library, for which he not only invented fictitious uncalibrated conventional radiocarbon age “data” (as he does for the Gospel of Judas here) but even did so with the mistaken assumption that there was any C-14 dating of the NHL at all.
Nonetheless you can see his assumptions on display in a chart that might look quite solid, even scientific, if you did not understand the dubious misinterpretations that went into making it.
This chart has no basis in fact and rests singularly on a misinterpretation of the meaning of the famous “280 CE +/- 60 years” bandied about in conversations regarding the Gospel of Judas. However, P. R. F. Brown can be credited, at least, for raising interesting questions regarding the distinction between the calibrated dates and uncalibrated data and for asking the question of how Jull arrived at his final results, and thus for prompting some of the further questioning on these matters, including this blog post.
What Next?
If the papers from Peter Head and Christian Askeland are any indication, scholarly evaluation of the radiocarbon dating of Codex Tchacos is already underway.
Perhaps my own blog post could represent some minor contribution; I don’t know. We still need to get a better handle, first-hand, on what exactly the data is for the samples dated (although I would be a little surprised if I am very far off in my analysis above of the second-hand account). We also would like to have a better and more explicit understanding of how the “95 percent confidence” of a date “between 220 and 340 CE” was calculated by Jull and his team. Certainly we could also use independent analysis by others with the requisite mathematical background to take the C-14 results and attempt their own, similar calculations (which might possibly have different results).
No doubt one of the important considerations in such an attempt would be a sober, scholarly assessment of which samples represent what, exactly, how they relate to each other, and how their dating relates to the dating of the codex itself. For example, could the samples with the earliest median dating (the first and third, or one of these two) simply be examples of cartonnage (dating before the codex itself)? Could the sample with the latest median dating (the second) be part of an insertion into the codex and thus younger than the manuscript of the Gospel of Judas itself? How does it affect things to treat any of these samples as having their own, different datings: does it become a matter of dating the latest of several objects? Or is it more strictly proper to look exclusively at the two samples of the numbered manuscript pages themselves (the last two listed)? Or should the third sample, including the leather of the cover, be combined with the samples of the numbered manuscript pages (as Krosney might seem to suggest, vaguely, was part of Jull’s analysis)? And, if so, what conclusions would we reach then? Or perhaps is it indeed proper to treat all five samples as belonging to the same object? And so on, and so on.
Such work would, to be done rigorously, require the close cooperation of scholarly insight and technical know-how; or, perhaps, both of them in the same person.


[…] […]